Identifying offsets - Binary exploitation

Before you continue
The content shown in this post is merely informative and its mission is to serve as a support to learn how to perform offset identification when it comes to exploiting binary security flaws. This information is distributed with the intention of serving as a learning experience for cybersecurity enthusiasts, never to carry out malicious practices.
- Architecture: x86_64
Welcome my fellow hackers to a new post where we will learn the basics of binary exploitation, the "offset identification". Offsets are an essential number when we talk about carrying out what is known as "Buffer Overflow". These techniques that I have mentioned have been used for decades to hack applications and programs of all kinds that managed resources in memory, and depending on the protections and resources of the hacker, they could and can cause the takeover of the device on which the application runs.
But let's not rush. Before we can take control of a system, we must first know how these attacks are carried out, and the first step to make one ourselves is to understand the bases. That is why I come to expose and explain to everyone, how to identify an offset.
What is an offset?
An offset in the context of binary exploitation means the number of bytes that must be exceeded within a buffer in order to overwrite the instruction pointer (rip) of the application.
 daemoncibsec
Why do we want to reach the instruction pointer?
Because the rip is in charge of executing the assembly language instructions that continue in memory. If we could overwrite the rip of a binary, that would mean that we could take control of the execution flow of the program, being able to perform actions such as "Command execution" or "ROP Chains", of which I have made an example in the following post.
 daemoncibsec
The post is in spanish version since I haven't had time to translate it. My apologies.
To look at it from a much more metaphorical approach, offset is the path that conducts to the injection of memory that contains the code in malicious assembly language that we will force the program to execute, preventing it from continuing its execution as planned and being able to take control of the binary.
What's a buffer?
A buffer is the memory space reserved for certain information (variables). We could say that the buffer is the space that is assigned to a piece of data with which the binary will operate. The buffer is usually of fixed size and if that limit is exceeded until it reaches the rip, what is known as "Segment Violation" (SIGSEGV) occurs, which means the cessation of execution of the binary due to the fact that it has accessed a memory area on which it did not have authorization (this is because the buffer limits are exceeded, it has entered the rip, the rip has tried to execute the data that has invaded the memory area on which it was due to the overflow of information in the buffer, and when trying to execute the information, it saw that it did not make sense and stopped the execution of the program).
In the example below, you can see the representation of a buffer in a more graphical way.
#include <stdio.h>
#include <string.h>

int main(int argc, char* argv[]) {
	char message[32];
	strcpy(message, argv[1]);
	printf("%s\n", message);
	return 0;
}
We declare a variable of type array of characters (char []) and the name we give it is message. The buffer, which is the size of the array (the size we reserve in memory) is 32 bytes, and taking into account that a character only occupies one byte, we can store a total of 32 characters in the buffer. Let's see what happens if we run the program and give the program a 13-byte string of characters.
❱❱ ./vuln "Hello World!"
Hello World!
As expected, the program performs its function, which is as follows:
Reserve 32 bytes in memory (Buffer)
                    ↓
Copy the character string from the first argument of the binary to the buffer
                    ↓
Access the memory address where the string is located (the buffer)
                    ↓
Use the content of the buffer to print it on the screen ("Hello World!")
Now, let's see what happens if I go out of the buffer a few more bytes.
❱❱ ./vuln "Hellooooooooooooo Wooooooooooooooooorld!"
Hellooooooooooooo Wooooooooooooooooorld!
Violación de segmento
Analyzing the binary
What has happened is that I have filled a 32-byte buffer with a 41-byte string of characters, leading the program to produce a SIGSEGV. Now, let's take a look from deeper. From the memory of the binary itself using "PwnDBG".
pwndbg> disas main
Dump of assembler code for function main:
   0x0000000000001149 <+0>:	push   rbp
   0x000000000000114a <+1>:	mov    rbp,rsp
   0x000000000000114d <+4>:	sub    rsp,0x30
   0x0000000000001151 <+8>:	mov    DWORD PTR [rbp-0x24],edi
   0x0000000000001154 <+11>:	mov    QWORD PTR [rbp-0x30],rsi
   0x0000000000001158 <+15>:	mov    rax,QWORD PTR [rbp-0x30]
   0x000000000000115c <+19>:	add    rax,0x8
   0x0000000000001160 <+23>:	mov    rdx,QWORD PTR [rax]
   0x0000000000001163 <+26>:	lea    rax,[rbp-0x20]
   0x0000000000001167 <+30>:	mov    rsi,rdx
   0x000000000000116a <+33>:	mov    rdi,rax
   0x000000000000116d <+36>:	call   0x1030 <strcpy@plt>
   0x0000000000001172 <+41>:	lea    rax,[rbp-0x20]
   0x0000000000001176 <+45>:	mov    rdi,rax
   0x0000000000001179 <+48>:	call   0x1040 <puts@plt>
   0x000000000000117e <+53>:	mov    eax,0x0
   0x0000000000001183 <+58>:	leave
   0x0000000000001184 <+59>:	ret
End of assembler dump.
pwndbg>
The above output shows us the assembly instructions that the binary executes. The instructions that go from +0 to +4 are what is called the procedure prologue (in charge of building the Stack). The instructions from +8 to +11 are the arguments that the binary collects, in addition to the environment variables, and the lines +15 to +59 are the instructions that the binary makes in assembly. To see more clearly how the information is stored in memory, let's look at the following. First, we will execute the program in GDB using the "run" command as follows:
pwndbg> run "Hello World!"
Starting program: /home/usuario/daemon/testing/bufferoverflow/vuln "Hello World!"
[Thread debugging using libthread_db enabled]
Using host libthread_db library "/lib/x86_64-linux-gnu/libthread_db.so.1".
Hello World!
[Inferior 1 (process 564284) exited normally]
As we can see, the binary is executed as expected and the string is saved in memory, and then it is printed on the screen. Now, let's see where in the memory it is saved, and to do this, we will set "breakpoints" that will stop the program while it is running. The first one I will set will be on the main+19 line, which performs the following instruction:
0x000000000000115c <+19>: add rax,0x8Add 8 bytes to rax, but we don't know why. To do this, we will have to find out what the previous instructions do. Now, I will set the breakpoint.
pwndbg> break *main+19
Breakpoint 1 at 0x115c: file vuln.c, line 6.
pwndbg> info break
Num     Type           Disp Enb Address            What
1       breakpoint     keep y   0x000000000000115c in main at vuln.c:6
pwndbg>
Next I'll run the binary with the string "Hello World!" again:
pwndbg> run "Hello world!"
Starting program: /home/usuario/daemon/testing/bufferoverflow/vuln "Hello world!"
[Thread debugging using libthread_db enabled]
Using host libthread_db library "/lib/x86_64-linux-gnu/libthread_db.so.1".

Breakpoint 1, 0x000055555555515c in main (argc=0x2, argv=0x7fffffffdf78) at vuln.c:6
6		strcpy(message, argv[1]);
As we can see in the debugger, we've stopped before executing the add rax,0x8 instruction.
pwndbg> disas main
Dump of assembler code for function main:
   0x0000555555555149 <+0>:	push   rbp
   0x000055555555514a <+1>:	mov    rbp,rsp
   0x000055555555514d <+4>:	sub    rsp,0x30
   0x0000555555555151 <+8>:	mov    DWORD PTR [rbp-0x24],edi
   0x0000555555555154 <+11>:	mov    QWORD PTR [rbp-0x30],rsi
   0x0000555555555158 <+15>:	mov    rax,QWORD PTR [rbp-0x30]
=> 0x000055555555515c <+19>:	add    rax,0x8
   0x0000555555555160 <+23>:	mov    rdx,QWORD PTR [rax]
   0x0000555555555163 <+26>:	lea    rax,[rbp-0x20]
   0x0000555555555167 <+30>:	mov    rsi,rdx
   0x000055555555516a <+33>:	mov    rdi,rax
   0x000055555555516d <+36>:	call   0x555555555030 <strcpy@plt>
   0x0000555555555172 <+41>:	lea    rax,[rbp-0x20]
   0x0000555555555176 <+45>:	mov    rdi,rax
   0x0000555555555179 <+48>:	call   0x555555555040 <puts@plt>
   0x000055555555517e <+53>:	mov    eax,0x0
   0x0000555555555183 <+58>:	leave
   0x0000555555555184 <+59>:	ret
End of assembler dump.
pwndbg>
If we check the above instructions, we can see that there is an instruction that says, "Save the memory address that is 30 bytes before the rbp register in the rax register."
mov rax,QWORD PTR [rbp-0x30]But we don't know what's inside rax, so we'll have to take a look. To do this, we'll use the x/ command in PwnDBG (although x/ is originally a GDB command).
pwndbg> x/xg $rbp-0x30
0x7fffffffde40:	0x00007fffffffdf88
Apparently it is saving the memory address 0x00007fffffffdf88 in rax. Let's continue to look at the adjacent instructions.
add rax,0x8Now we see that 8 bytes are added to rax. Let's see why that happens.
pwndbg> info reg rax
rax            0x7fffffffdf88      0x7fffffffdf88
As we can see in the output above, it appears that it stores a memory address. Let's see what's inside the memory address.
pwndbg> x/xg 0x7fffffffdf88
0x7fffffffdf88:	0x00007fffffffe2c3
A new memory address appears, in this case, 0x00007fffffffe2c3. If we look at what resides inside this new memory address, the program that is running, i.e., argument number 0.
pwndbg> x/s 0x00007fffffffe2c3
0x7fffffffe2c3:	"/home/usuario/daemon/testing/bufferoverflow/vuln"
And if we add eight bytes of memory to the 0x7fffffffdf88 address, we end up with a second region of memory, which is the one that stores argument number 1, that is, the string of characters.
pwndbg> x/xg 0x7fffffffdf88+8
0x7fffffffdf90:	0x00007fffffffe2f4
pwndbg> x/s 0x00007fffffffe2f4
0x7fffffffe2f4:	"Hello World!"
pwndbg>
Understanding the buffer
If we look at the bytes occupied by the string with the x/32xb command, we can see that the string (Hello World!) occupies a total of 12 bytes. However, the string is added to the byte 0x00, which is known as the "Null Terminator", which is responsible for separating information in memory. Without the Null Terminator, the string of characters would continue to expand through memory and the string would have no end, so the total length of the string is 13 bytes.
pwndbg> x/32xb 0x00007fffffffe2f4
0x7fffffffe2f4:	0x48	0x65	0x6c	0x6c	0x6f	0x20	0x57	0x6f
0x7fffffffe2fc:	0x72	0x6c	0x64	0x21	0x00	0x53	0x48	0x45
0x7fffffffe304:	0x4c	0x4c	0x3d	0x2f	0x62	0x69	0x6e	0x2f
0x7fffffffe30c:	0x62	0x61	0x73	0x68	0x00	0x57	0x49	0x4e
pwndbg>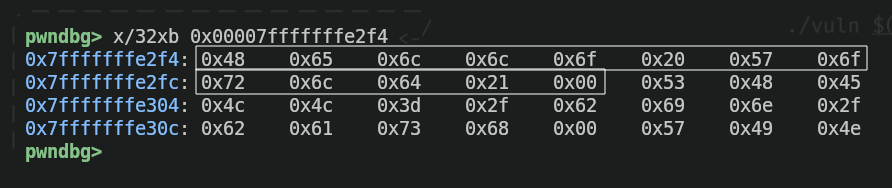
But how do I know that those 13 bytes belong to the 12 letters of Hello World! plus the Null Terminator? Well, because those bytes are representations of hexadecimal letters, as shown in this image.
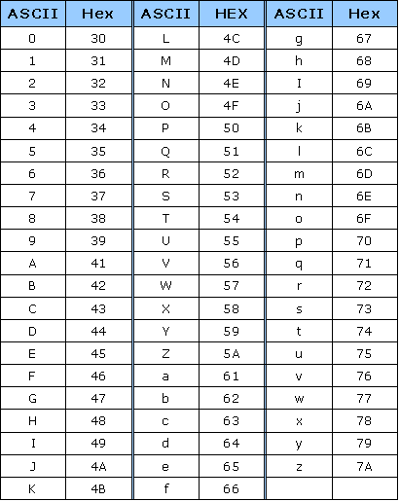
The H would be equivalent to 0x48, the e would be equivalent to 0x65, and so on. So 0x6f57206f6c6c6548 would be Hello Wo and the next byte octet, 0x0021646c72, would be rld!.
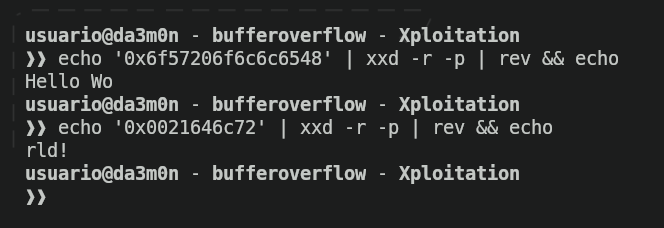
Then that string will be moved to a reserved memory space of 32 bytes. I've inserted another breakpoint into the line where you define the buffer so that you can see it clearly.
pwndbg> disas main
Dump of assembler code for function main:
   0x0000555555555149 <+0>:	push   rbp
   0x000055555555514a <+1>:	mov    rbp,rsp
   0x000055555555514d <+4>:	sub    rsp,0x30
   0x0000555555555151 <+8>:	mov    DWORD PTR [rbp-0x24],edi
   0x0000555555555154 <+11>:	mov    QWORD PTR [rbp-0x30],rsi
   0x0000555555555158 <+15>:	mov    rax,QWORD PTR [rbp-0x30]
   0x000055555555515c <+19>:	add    rax,0x8
   0x0000555555555160 <+23>:	mov    rdx,QWORD PTR [rax]
   0x0000555555555163 <+26>:	lea    rax,[rbp-0x20]
=> 0x0000555555555167 <+30>:	mov    rsi,rdx
   0x000055555555516a <+33>:	mov    rdi,rax
   0x000055555555516d <+36>:	call   0x555555555030 <strcpy@plt>
   0x0000555555555172 <+41>:	lea    rax,[rbp-0x20]
   0x0000555555555176 <+45>:	mov    rdi,rax
   0x0000555555555179 <+48>:	call   0x555555555040 <puts@plt>
   0x000055555555517e <+53>:	mov    eax,0x0
   0x0000555555555183 <+58>:	leave
   0x0000555555555184 <+59>:	ret
End of assembler dump.
pwndbg> x/32xb $rax
0x7fffffffde50:	0x00	0x00	0x00	0x00	0x00	0x00	0x00	0x00
0x7fffffffde58:	0x00	0x56	0xfe	0xf7	0xff	0x7f	0x00	0x00
0x7fffffffde60:	0x00	0x00	0x00	0x00	0x00	0x00	0x00	0x00
0x7fffffffde68:	0x00	0xdf	0xff	0xff	0xff	0x7f	0x00	0x00
pwndbg>
The rax register now contains the buffer location, and what will be executed next will paste the contents of rdx (which now contains the Hello World!) string into the buffer location. If we continue the execution and check the buffer again, we find that the string has indeed been pasted into the buffer.
pwndbg> continue
pwndbg> x/32xb $rax
0x7fffffffde50:	0x48	0x65	0x6c	0x6c	0x6f	0x20	0x57	0x6f
0x7fffffffde58:	0x72	0x6c	0x64	0x21	0x00	0x7f	0x00	0x00
0x7fffffffde60:	0x00	0x00	0x00	0x00	0x00	0x00	0x00	0x00
0x7fffffffde68:	0x00	0xdf	0xff	0xff	0xff	0x7f	0x00	0x00
pwndbg> x/s $rax
0x7fffffffde50:	"Hello World!"
pwndbg>
We can see how the buffer fills up if instead of specifying a 13-character string we put a 32-character string (32 bytes, the same size as the buffer).
pwndbg> run AAAAAAAAAAAAAAAAAAAAAAAAAAAAAAAA
pwndbg> continue
pwndbg> continue
pwndbg> x/s $rax
0x7fffffffde30:	'A' <repeats 32 times>
pwndbg> x/32xb $rax
0x7fffffffde30:	0x41	0x41	0x41	0x41	0x41	0x41	0x41	0x41
0x7fffffffde38:	0x41	0x41	0x41	0x41	0x41	0x41	0x41	0x41
0x7fffffffde40:	0x41	0x41	0x41	0x41	0x41	0x41	0x41	0x41
0x7fffffffde48:	0x41	0x41	0x41	0x41	0x41	0x41	0x41	0x41
pwndbg>
Identifying the offset
Now that we have observed how the buffer is filled, we must explain what Buffer Overflow is and how to carry out the first step to achieve it: Identify the offset.
Identifying offset is possible thanks to many factors, and there are several ways to identify the offset of a binary.
- First option: Use the
cyclicandcyclic_findfunctions inpwntools(orcyclicandcyclic -lin PwnDBG). - Second option: Identify the offset manually by observing the registers when overflowing the stack.
First option
First we will generate a long string of characters that will ensure that we overflow the buffer. We can choose the size we want, but in this case I will choose a string of a size of 100 bytes. To do this, I will use the following command that generates a string with a specific pattern of characters that allows me to identify at what point the buffer overflows.
❱❱ pwn cyclic -n 8 100
aaaaaaaabaaaaaaacaaaaaaadaaaaaaaeaaaaaaafaaaaaaagaaaaaaahaaaaaaaiaaaaaaajaaaaaaakaaaaaaalaaaaaaamaaa
Now I'll put this string into PwnDBG and run the binary.
pwndbg> run aaaaaaaabaaaaaaacaaaaaaadaaaaaaaeaaaaaaafaaaaaaagaaaaaaahaaaaaaaiaaaaaaajaaaaaaakaaaaaaalaaaaaaamaaa
Starting program: /home/usuario/daemon/testing/bufferoverflow/vuln aaaaaaaabaaaaaaacaaaaaaadaaaaaaaeaaaaaaafaaaaaaagaaaaaaahaaaaaaaiaaaaaaajaaaaaaakaaaaaaalaaaaaaamaaa
[Thread debugging using libthread_db enabled]
Using host libthread_db library "/lib/x86_64-linux-gnu/libthread_db.so.1".
aaaaaaaabaaaaaaacaaaaaaadaaaaaaaeaaaaaaafaaaaaaagaaaaaaahaaaaaaaiaaaaaaajaaaaaaakaaaaaaalaaaaaaamaaa

Program received signal SIGSEGV, Segmentation fault.
Looking more closely at the details about the registries and the disassembled instructions, we find the following.
───────────────────────────────────────────────────────────────────[ DISASM / x86-64 / set emulate on ]───────────────────────────────────────────────────────────────────
 ► 0x555555555184 <main+59>    ret                                <0x6161616161616166>
    ↓
NOTE: This value can also be obtained from the logs in case you can't find it in the program's crash detail. To be able to observe it, you simply have to put the following command in PwnDBG and look at the value that is stored inside the memory address that stores the rsp register:
pwndbg> info reg
rax            0x0                 0x0
rbx            0x7fffffffdf28      0x7fffffffdf28
rcx            0x0                 0x0
rdx            0x0                 0x0
rsi            0x5555555592a0      0x5555555592a0
rdi            0x7ffff7f887b0      0x7ffff7f887b0
rbp            0x6161616161616165  0x6161616161616165
rsp            0x7fffffffde18      0x7fffffffde18
r8             0x0                 0x0
r9             0x0                 0x0
r10            0x0                 0x0
r11            0x202               0x202
r12            0x0                 0x0
r13            0x7fffffffdf40      0x7fffffffdf40
r14            0x7ffff7ffd000      0x7ffff7ffd000
r15            0x555555557dd8      0x555555557dd8
rip            0x555555555184      0x555555555184 <main+59>
eflags         0x10202             [ IF RF ]
cs             0x33                0x33
ss             0x2b                0x2b
ds             0x0                 0x0
es             0x0                 0x0
fs             0x0                 0x0
gs             0x0                 0x0
fs_base        0x7ffff7d9e740      0x7ffff7d9e740
gs_base        0x0                 0x0
pwndbg> x/xg 0x7fffffffde18
0x7fffffffde18: 0x6161616161616166
pwndbg>As you can see, this is exactly the pattern we're looking for.
The byte pattern 0x6161616161616166 belongs to the faaaaaaaaa characters. Because of how Pwntools is designed, with the f of that string of characters it is able to detect the byte where the buffer overflows and with a simple mathematical operation, it returns the offset. This can be achieved with the cyclic -n8 -l command.
pwndbg> cyclic -n8 -l 0x6161616161616166
Finding cyclic pattern of 8 bytes: b'faaaaaaa' (hex: 0x6661616161616161)
Found at offset 40
pwndbg>
In this case, the offset is 40.
Second option
The second option is to manually manage the byte value given to the binary until it overflows, and fine-tune the byte value until you find the exact number that leads to the offset. Here is a demonstration.
With the same binary, I want to be able to overflow it, so I insert a number of bytes that I know will cause the overflow. In this case, 100 bytes as in the previous example (the 100 bytes will be a total of 92 bytes symbolizing being the letter "A" and 8 bytes symbolizing being the letter "B").
pwndbg> run AAAAAAAAAAAAAAAAAAAAAAAAAAAAAAAAAAAAAAAAAAAAAAAAAAAAAAAAAAAAAAAAAAAAAAAAAAAAAAAAAAAAAAAAAAAABBBBBBBB
Starting program: /home/usuario/daemon/testing/bufferoverflow/vuln AAAAAAAAAAAAAAAAAAAAAAAAAAAAAAAAAAAAAAAAAAAAAAAAAAAAAAAAAAAAAAAAAAAAAAAAAAAAAAAAAAAAAAAAAAAABBBBBBBB
[Thread debugging using libthread_db enabled]
Using host libthread_db library "/lib/x86_64-linux-gnu/libthread_db.so.1".
AAAAAAAAAAAAAAAAAAAAAAAAAAAAAAAAAAAAAAAAAAAAAAAAAAAAAAAAAAAAAAAAAAAAAAAAAAAAAAAAAAAAAAAAAAAABBBBBBBB

Program received signal SIGSEGV, Segmentation fault.
As I have seen that the error has occurred, I can observe the detail of the crash to see what value has remained in the rsp register.
───────────────────────────────────────────────────────────────────[ DISASM / x86-64 / set emulate on ]───────────────────────────────────────────────────────────────────
 ► 0x555555555184 <main+59>    ret                                <0x4141414141414141>
    ↓
A good way to check the offset is to check if the last 8 bytes are the ones assigned to the letter "B". If so, the number of bytes of the letter "A" indicates the offset. Now, seeing that a segment violation (a crash) has occurred, I will try to reduce the number of bytes by half to see if I can finally find the offset now.
pwndbg> run AAAAAAAAAAAAAAAAAAAAAAAAAAAAAAAAAAAAAAAAAABBBBBBBB
Starting program: /home/usuario/daemon/testing/bufferoverflow/vuln AAAAAAAAAAAAAAAAAAAAAAAAAAAAAAAAAAAAAAAAAABBBBBBBB
[Thread debugging using libthread_db enabled]
Using host libthread_db library "/lib/x86_64-linux-gnu/libthread_db.so.1".
AAAAAAAAAAAAAAAAAAAAAAAAAAAAAAAAAAAAAAAAAABBBBBBBB

Program received signal SIGSEGV, Segmentation fault.
Looking at the detail at the bottom, I can see that I'm getting close to hitting the exact offset.
───────────────────────────────────────────────────────────────────[ DISASM / x86-64 / set emulate on ]───────────────────────────────────────────────────────────────────
 ► 0x555555555184 <main+59>    ret                                <0x4242424242424141>
    ↓
That string that has been left in the rsp register coincides with the string of characters AABBBBBBBB, which means that I have 2 bytes left over corresponding to the letter "A". If in the previous example I generated the 50-byte string by composing it with 42 bytes of letters "A" and 8 bytes of letters "B", and to get the offset I must remove two letters "A", that would indicate that the offset is the number 40 (because remember that the offset is equal to the number of letters "A" that we have specified in the string).
pwndbg> run AAAAAAAAAAAAAAAAAAAAAAAAAAAAAAAAAAAAAAAABBBBBBBB
Starting program: /home/usuario/daemon/testing/bufferoverflow/vuln AAAAAAAAAAAAAAAAAAAAAAAAAAAAAAAAAAAAAAAABBBBBBBB
[Thread debugging using libthread_db enabled]
Using host libthread_db library "/lib/x86_64-linux-gnu/libthread_db.so.1".
AAAAAAAAAAAAAAAAAAAAAAAAAAAAAAAAAAAAAAAABBBBBBBB

Program received signal SIGSEGV, Segmentation fault.
───────────────────────────────────────────────────────────────────[ DISASM / x86-64 / set emulate on ]───────────────────────────────────────────────────────────────────
► 0x555555555184 <main+59> ret <0x4242424242424242>
↓In the example above, we would have obtained the offset. And finally, to check that we have found the exact offset (in case there is any hint of doubt), we will do the following. We will test to see if a segment violation occurs using 40 bytes, and if it does, we will test using 39. Since we said that the offset is the number of bytes that we must reach until we can control the rip, and the segment violation occurs when the rip does not find instructions to execute, as soon as we get the offset a segment violation should occur. We will test the theory with the following command:
pwndbg> run AAAAAAAAAAAAAAAAAAAAAAAAAAAAAAAAAAAAAAAA
Starting program: /home/usuario/daemon/testing/bufferoverflow/vuln AAAAAAAAAAAAAAAAAAAAAAAAAAAAAAAAAAAAAAAA
[Thread debugging using libthread_db enabled]
Using host libthread_db library "/lib/x86_64-linux-gnu/libthread_db.so.1".
AAAAAAAAAAAAAAAAAAAAAAAAAAAAAAAAAAAAAAAA

Program received signal SIGSEGV, Segmentation fault.
And as we can see, with 40 bytes corresponding to the letter "A" the segment violation (SIGSEGV) occurs. Trying with 39 bytes, on the other hand, does not cause a segment violation.
pwndbg> run AAAAAAAAAAAAAAAAAAAAAAAAAAAAAAAAAAAAAAA
Starting program: /home/usuario/daemon/testing/bufferoverflow/vuln AAAAAAAAAAAAAAAAAAAAAAAAAAAAAAAAAAAAAAA
[Thread debugging using libthread_db enabled]
Using host libthread_db library "/lib/x86_64-linux-gnu/libthread_db.so.1".
AAAAAAAAAAAAAAAAAAAAAAAAAAAAAAAAAAAAAAA
[Inferior 1 (process 487511) exited normally]
pwndbg>
So effectively, the offset is 40. And in these two ways, we have been able to obtain the offset of a binary and go one step further in the exploitation of it until we get a shell or make a ROP chain.