Memory Segmentation - Hacking: The Art Of Exploitation


Legal warning
Although the information shown in this publication is merely educational, the inappropriate/malicious use of memory corruption techniques that can be executed with this knowledge is prohibited under certain legal contexts and such activity may be punishable. You are warned.
Welcome my fellow hackers to this post where you will learn about the memory of a program and how it works. The inspiration to make this publication was because I have started reading "Hacking: The Art Of Exploitation" and there is a chapter in the book dedicated to memory segmentation, how it works, and how programs are composed when it comes to memory. It should be clarified that although the book is very old and was written for x86 architectures (see "Assembly Notes"), it is possible to learn a lot today.
Memory segmentation
Quoting the book itself, "the memory of a compiled program is divided into 5 segments". The segments we find are the following:
text
Code segment. This is where the instructions assembled in machine (binary) code are located. This is a read-only segment, that is, you cannot change the in-memory content of this segment.
data
It contains the initialized (variables that are assigned a value in their own creation) global and static variables of the program. It is a read/write segment, that is, the in-memory content of this segment can be changed (but the sizes for the variables remain fixed).
#include <stdio.h>

int main() {
  char message[10] = "Hello";

  printf("%s\n", message);

  return 0;
}
The variable "message" is an initialized variable because it has been assigned a value in its creation. If you wanted to rewrite the variable "message" in memory, you could only write the 10 bytes assigned to it, no more, no less.
bss
It contains variables that have not been initialized. This is a read/write segment, i.e. you can change the in-memory content of this segment (but the sizes for the variables remain fixed).
#include <stdio.h>
#include <string.h>

int main() {
  char message[10];

  strcpy(message, "Hello");

  printf("%s\n", message);

  return 0;
}
Unlike in the previous example, "message" is a variable that has not been initialized because it has not been assigned a value at its creation, but after it. As with the "data" section, the size in the memory section remains fixed, so you cannot write more than 10 bytes in this variable.
heap
This memory segment is one that the programmer can control directly. The memory blocks in this segment can be allocated and used for whatever the programmer needs. This is a read/write segment, i.e. the in-memory content of the segment can be changed. In addition. The segment does not have a fixed size, so it can grow and decrease at will, unlike the other segments that have a fixed size. The heap grows and decreases thanks to allocation and deallocation algorithms, which allow unreserved memory to be reused in the other segments. This is done in the execution of the program itself. The growth of the heap is used to reach larger and larger regions of memory within the memory stack (the set of segments).
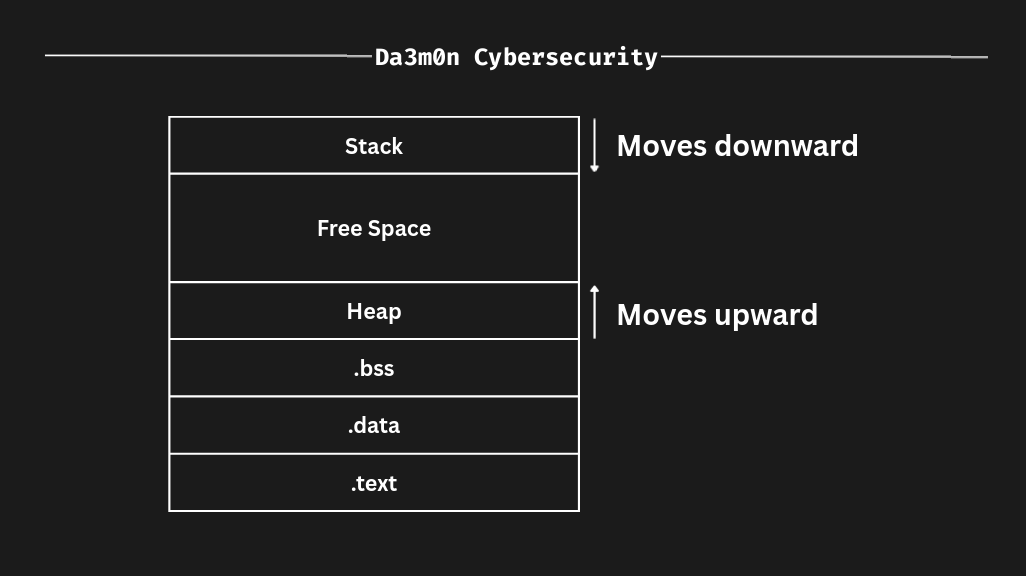
stack
The stack is, as shown in the image above and as with the heap, is a segment with variable size, which can be used as temporary storage space to store, for example, local variables. This is what the backtrace command in GDB (GNU Debugger) checks. When a function is called, the stack is used to store the set of variables that have been passed from one function to another by changing the context.
#include <stdio.h>

int print_output(char *variable) {
  printf("%s\n", variable);

  return 0;
}

int main() {
  char message[] = "Hello";

  print_output(message);

  return 0;
}
In this example, when the context of the variable "message" changes to the variable "variable" in the print_output function, the variable containing the value "Hello" is stored within the stack segment.
The stack not only stores the variables that change context (variables that are passed between functions), it also stores information about the position of the instruction pointer (rip) before accessing the new function. Taking advantage of the previous code, if the rip was on the print_output(message); line, when the next instruction is executed, the instruction pointer will jump to the printf("%s\n", variable) line, and then execute the function by displaying Hello. In order to return to the main function, it must store in memory the memory address that goes after print_output(message);, which would take the instruction pointer to return 0, ending the execution of the program. The return address after finishing the execution of a function is what is stored in the stack along with variables that change context. In addition to this, the stack also stores the new local variables of the function to which it is jumping. All of this information is stored in what's often called a stack frame, and in the stack, there are many stack frames.
As already seen in "Assembly Notes", the stack is an abstract data structure, that is, it can be interpreted in many ways. Even so, in all the ways in which it can be interpreted, the stack follows the principle "LIFO" (Last-in, first-out), which indicates that the last data to be inserted into the stack will be the first to leave it. When we want to insert information into the stack, what we do is something known as "pushing", and when we want to extract information, what we do is something known as "popping".
As the name suggests, the stack memory segment refers to the data structure of the stack itself. which contains many stack frames. The stack pointer register (rsp) is used to monitor where the stack ends, since the memory address where the stack ends is in constant movement due to the size of the stack varying due to the introduction and expulsion of data within the stack. Because it is a very dynamic task, it is understandable why the stack does not have a fixed size, since you will never know if a larger or smaller size will be needed to store the amount of data it requires. Unlike the stack, as shown above in an image, the stack decreases towards smaller memory addresses, getting closer and closer to the heap.
Each time we call a function, a new stack frame is loaded with the necessary information (new local variables, the rip's return address, and variables that are passed between functions). The rbp register, also sometimes called the "frame pointer" (FP) or "local base" (BP), is used as a reference for the variables of the local function. Each stack frame contains the parameters for the functions, their local variables, and two pointers that are needed to put things back where they were before the new stack frame was created (i.e., before the function was called). The SFP (saved frame pointer) is used to restore rbp to its previous value, and the "return address" is used to restore the rip to the next statement after the function call (as mentioned above). This restores the functional context of the previous stack frame.
For practice, the following example code stack_example.c has two functions: main and test_function:
#include <stdio.h>

void test_function(int a, int b, int c, int d) {
  int flag;
  char buffer[10];

  flag = 31337;
  buffer[0] = 'A';
}

int main() {
  test_function(1, 2, 3, 4);
}
When we disassemble the binary into assembly instructions, we can observe these instructions that correspond to the code inside the main function:
pwndbg> disas main
Dump of assembler code for function main:
   0x0000000000001147 <+0>:	push   rbp
   0x0000000000001148 <+1>:	mov    rbp,rsp
   0x000000000000114b <+4>:	mov    ecx,0x4
   0x0000000000001150 <+9>:	mov    edx,0x3
   0x0000000000001155 <+14>:	mov    esi,0x2
   0x000000000000115a <+19>:	mov    edi,0x1
   0x000000000000115f <+24>:	call   0x1129 <test_function>
   0x0000000000001164 <+29>:	mov    eax,0x0
   0x0000000000001169 <+34>:	pop    rbp
   0x000000000000116a <+35>:	ret
End of assembler dump.
pwndbg>
The instructions that make up the lines main <+0> and main <+1> are the so-called "procedure prologue" or "function prologue". They are responsible for storing the frame pointer in the stack frame, and depending on the compiler and compilation options, they can even align the stack. As we can see, these instructions are also reflected in the test_function function, where when starting a new stack frame, the frame pointer is stored again.
pwndbg> disas test_function
Dump of assembler code for function test_function:
   0x0000000000001129 <+0>:	push   rbp                         <---
   0x000000000000112a <+1>:	mov    rbp,rsp                     <---
   0x000000000000112d <+4>:	mov    DWORD PTR [rbp-0x14],edi
   0x0000000000001130 <+7>:	mov    DWORD PTR [rbp-0x18],esi
   0x0000000000001133 <+10>:	mov    DWORD PTR [rbp-0x1c],edx
   0x0000000000001136 <+13>:	mov    DWORD PTR [rbp-0x20],ecx
   0x0000000000001139 <+16>:	mov    DWORD PTR [rbp-0x4],0x7a69
   0x0000000000001140 <+23>:	mov    BYTE PTR [rbp-0xe],0x41
   0x0000000000001144 <+27>:	nop
   0x0000000000001145 <+28>:	pop    rbp
   0x0000000000001146 <+29>:	ret
End of assembler dump.
pwndbg>
In addition, (this has little to do with segmentation, but I found it interesting to emphasize) we can see how the numbers "1", "2", "3" and "4" are assigned to each of the variables "a", "b", "c" and "d" respectively.
pwndbg> disas test_function
Dump of assembler code for function test_function:
   0x0000000000001129 <+0>:	push   rbp
   0x000000000000112a <+1>:	mov    rbp,rsp
   0x000000000000112d <+4>:	mov    DWORD PTR [rbp-0x14],edi     <---
   0x0000000000001130 <+7>:	mov    DWORD PTR [rbp-0x18],esi     <---
   0x0000000000001133 <+10>:	mov    DWORD PTR [rbp-0x1c],edx     <---
   0x0000000000001136 <+13>:	mov    DWORD PTR [rbp-0x20],ecx     <---
   0x0000000000001139 <+16>:	mov    DWORD PTR [rbp-0x4],0x7a69
   0x0000000000001140 <+23>:	mov    BYTE PTR [rbp-0xe],0x41
   0x0000000000001144 <+27>:	nop
   0x0000000000001145 <+28>:	pop    rbp
   0x0000000000001146 <+29>:	ret
End of assembler dump.
pwndbg>
We can check this by examining the content of the pointers shown in the previous lines (rbp-0x14, rbp-0x18, rbp-0x1c and rbp-0x20).
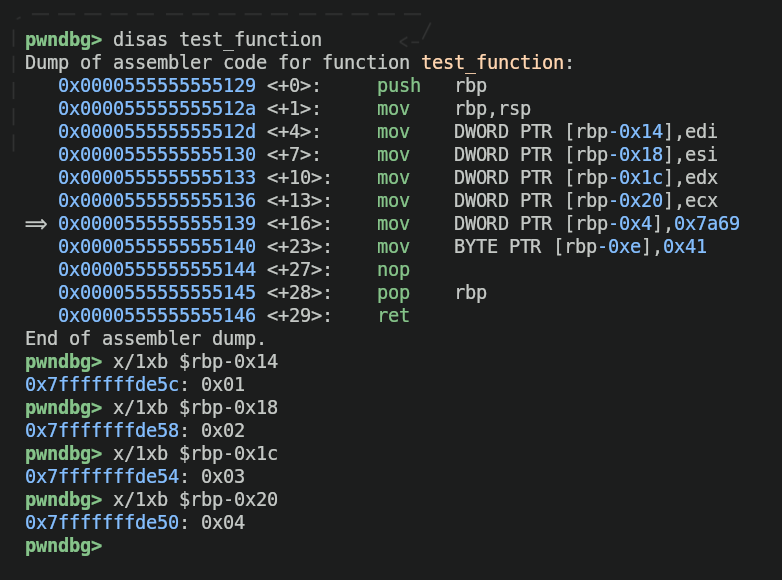
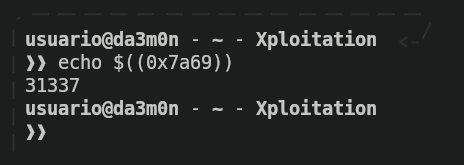
The next line (0x0000555555555139) contains the flag "31337", only encoded in binary format as you can see below.
Going back to the "main" function, specifically to the 0x000055555555515f line.
pwndbg> disas main
Dump of assembler code for function main:
   0x0000555555555147 <+0>:	push   rbp
   0x0000555555555148 <+1>:	mov    rbp,rsp
   0x000055555555514b <+4>:	mov    ecx,0x4
   0x0000555555555150 <+9>:	mov    edx,0x3
   0x0000555555555155 <+14>:	mov    esi,0x2
   0x000055555555515a <+19>:	mov    edi,0x1
   0x000055555555515f <+24>:	call   0x555555555129 <test_function>    <---
   0x0000555555555164 <+29>:	mov    eax,0x0
   0x0000555555555169 <+34>:	pop    rbp
   0x000055555555516a <+35>:	ret
End of assembler dump.
pwndbg>
In the next step, the current value of "rbp" is stored in the stack (due to the nature of the "call" statement). This value is known as "saved frame pointer" (SPF, which we talked about earlier), and it is the one that will be used to restore "rbp" to its original value after the test_function function is finished.
Now, we can see how the stack is built from 0 thanks to GDB in a more practical way. To do this, I will use a piece of code written in the book "Hacking: The Art Of Exploitation" to demonstrate it (I made some changes to it, however, the behaviour remains the same).
#include <stdio.h>
#include <stdlib.h>

int global_var;
int global_initialized_var = 5;

void function() {	// This is just a demo function
	int stack_var;	// Notice this variable has the same name as the one in main().

	printf("the function's stack_var is at address %p\n", &stack_var);
}

int main() {
	int stack_var;	// Same name as the variable in function()
	static int static_initialized_var = 5;
	static int static_var;
	int *heap_var_ptr;

	heap_var_ptr = (int *) malloc(4);

	// These variables are in the data segment
	printf("global_initialized_var is at address %p\n", &global_initialized_var);
	printf("static_initialized_var is at address %p\n\n", &static_initialized_var);

	// These variables are in the bss segment
	printf("global_var is at address %p\n", &global_var);
	printf("static_var is at address %p\n\n", &static_var);

	// This variable is in the heap segment
	printf("heap_var is at address %p\n\n", heap_var_ptr);

	// These variables are in the stack segment
	printf("stack_var is at address %p\n", &stack_var);
	function();

	return 0;
}
memory_segmentation.c
I'll open GDB to check the memory addresses where the information is stored. To do this, I'll put breakpoints at the end of the function function to prevent the program from finishing execution.
pwndbg> disas function
Dump of assembler code for function function:
   0x0000555555555149 <+0>:	push   rbp
   0x000055555555514a <+1>:	mov    rbp,rsp
   0x000055555555514d <+4>:	sub    rsp,0x10
   0x0000555555555151 <+8>:	lea    rax,[rbp-0x4]
   0x0000555555555155 <+12>:	mov    rsi,rax
   0x0000555555555158 <+15>:	lea    rax,[rip+0xea9]        # 0x555555556008
   0x000055555555515f <+22>:	mov    rdi,rax
   0x0000555555555162 <+25>:	mov    eax,0x0
   0x0000555555555167 <+30>:	call   0x555555555030 <printf@plt>
   0x000055555555516c <+35>:	nop
   0x000055555555516d <+36>:	leave
   0x000055555555516e <+37>:	ret
End of assembler dump.
pwndbg> break *0x000055555555516c
Breakpoint 1 at 0x55555555516c: file memory_segmentation.c, line 11.
pwndbg>
And when we run the application, the following appears.
pwndbg> run
Starting program: /home/usuario/daemon/knowledge/c/code/memory_segmentation
[Thread debugging using libthread_db enabled]
Using host libthread_db library "/lib/x86_64-linux-gnu/libthread_db.so.1".
global_initialized_var is at address 0x555555558020
static_initialized_var is at address 0x555555558024

global_var is at address 0x55555555802c
static_var is at address 0x555555558030

heap_var is at address 0x5555555592a0

stack_var is at address 0x7fffffffde14
the function's stack_var is at address 0x7fffffffddfc

Breakpoint 1, function () at memory_segmentation.c:11
11	}
LEGEND: STACK | HEAP | CODE | DATA | WX | RODATA
As we can see, the variables that are initialized in the data segment are those that are stored in the lowest addresses of the RAM memory, the uninitialized variables in the bss segment are stored in addresses with higher numbers than in the data section, but lower than heap. The heap section is stored in an address with a much higher number than the previous ones, and the stack, as you can see, is stored in a much higher address than the others.
pwndbg> x/w 0x555555558020
0x555555558020 <global_initialized_var>:	0x00000005
pwndbg> x/w 0x55555555802c
0x55555555802c <global_var>:	0x00000000
pwndbg> x/w 0x5555555592a0
0x5555555592a0:	0x00000000
pwndbg> x/w 0x7fffffffde14
0x7fffffffde14:	0x00000000
References